Technical analysis of Bitcoin and other crypto currencies is all about support and resistance zones … areas that price has reacted off of in the past. This type of analysis is very reliable due to the lack of institutionalized high frequency trading algorithms that have not really come into the crypto space yet. Because a lot of retail traders and all smart money traders look for support and resistance zones, they kind of become a self fulfilling prophecy. There are a few types of support and resistance, but for now, we will only look at horizon, diagonal, and moving average support and resistance.
Below is a daily chart of Bitcoin over the last six months. I have drawn several horizontal lines of key support and resistance and highlighted the areas where price has reacted off of them. I have also drawn one diagonal support line that represents the current up-trend, and I have highlighted one area where price, very recently, has reacted off of the 200 day Exponential Moving Average. TradingView Chart — TradingView
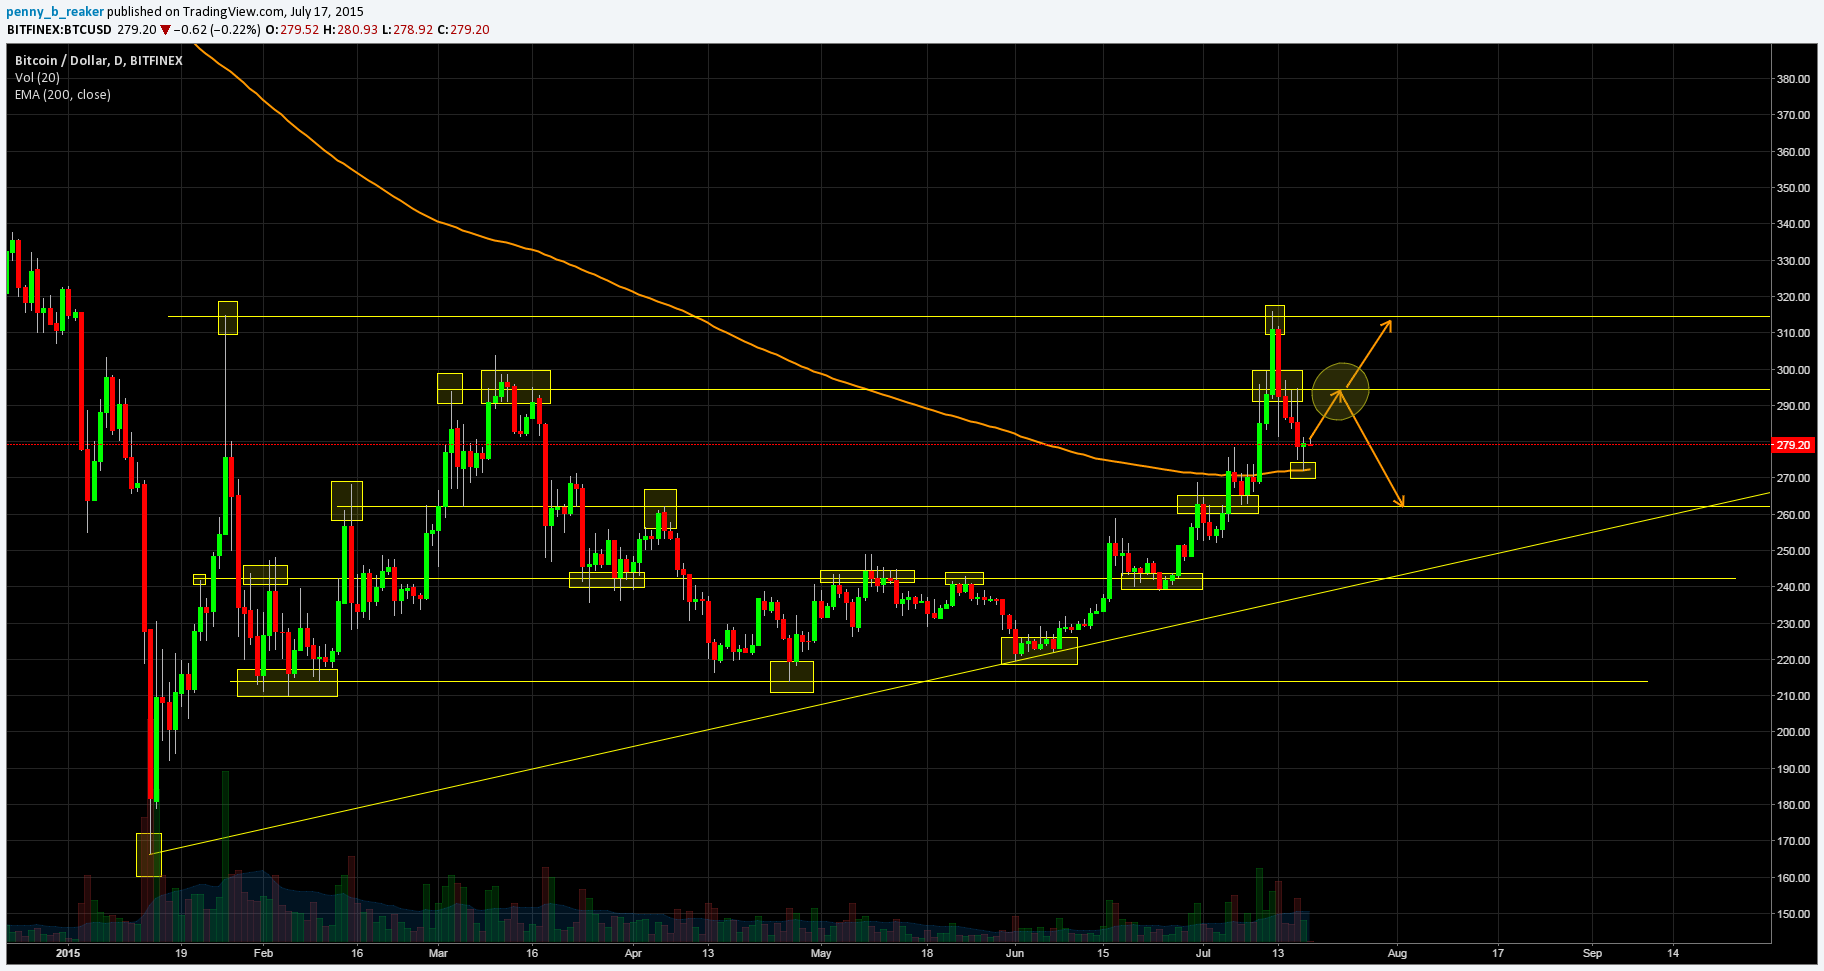
Due to the fact that price is trading above the 200 EMA, price recently bounced off of the 200 EMA, and momentum is clearly to the upside, there is a very high likelihood that we will retest the 295 area (noted by the circle). In trading, it is very important to be aware of all the possibilities, rather than getting married to one point of view, as indicated by the arrows. Support and resistance tells us where to look to next, once one of those possibilities begins to play out.
If you are attempting to trade any market on a lower time frame, and you are not going through this exercise of zooming out to the daily or weekly time frame to identify support/resistance, you are doing yourself a disservice.
Later, we will look into support and resistance zones of Fibonacci retracements and extensions.
BIG FYI: These are my personal opinions based on my experience. If you base your trades off of any of the information I post, that is YOUR BAD. Always do your own analysis before placing a trade!