[ANN] ALix & RAW.Coinerella - 10.01.2016 till 10.07.2016

Hi @ all,

let me announce the following:

  • This grant passed 8 Jan 2016 13:28:46 (Proposal on Daology)

  • The contract period for ALix and RAW.Coinerella starts today and will end 10.07.2016 23:59 (UTC)

  • NuLagoon Tube has been integrated to ALix Walls and ALix Volume

  • Commercials have been removed

  • CloudFlare Pro and Pingdom are active

  • Source code for ALix has been published on https://github.com/bananenwilly/alix

  • The sequel of this operation will be evaluated by 10.06.2016

Thanks,

Willy

7 Likes

Great to have Nu lagoon tube. Perhaps you should put the whole title (add “Tube”) ?

Of course. Done.

1 Like
  • ALix Volume will show a 90 day MA starting this night
1 Like

Is registering a servie to receive alarms (by email?) if thresholds are violated in the road map?

It’s right on a sticky note on my monitor.

The hardest task is finding an equilibrium between spam and information.

User defined frequency and threshold?

Yes, that’s what I’m thinking of.

I’ll also need to cluster that user database to keep up with my high availability targets. That’s gonna need some research, never did that before.

Cryptsy is to be removed, i guess :wink:

Yes, I’ll disable it now.
But I guess I will leave the API wrappers in the code for a while.

1 Like

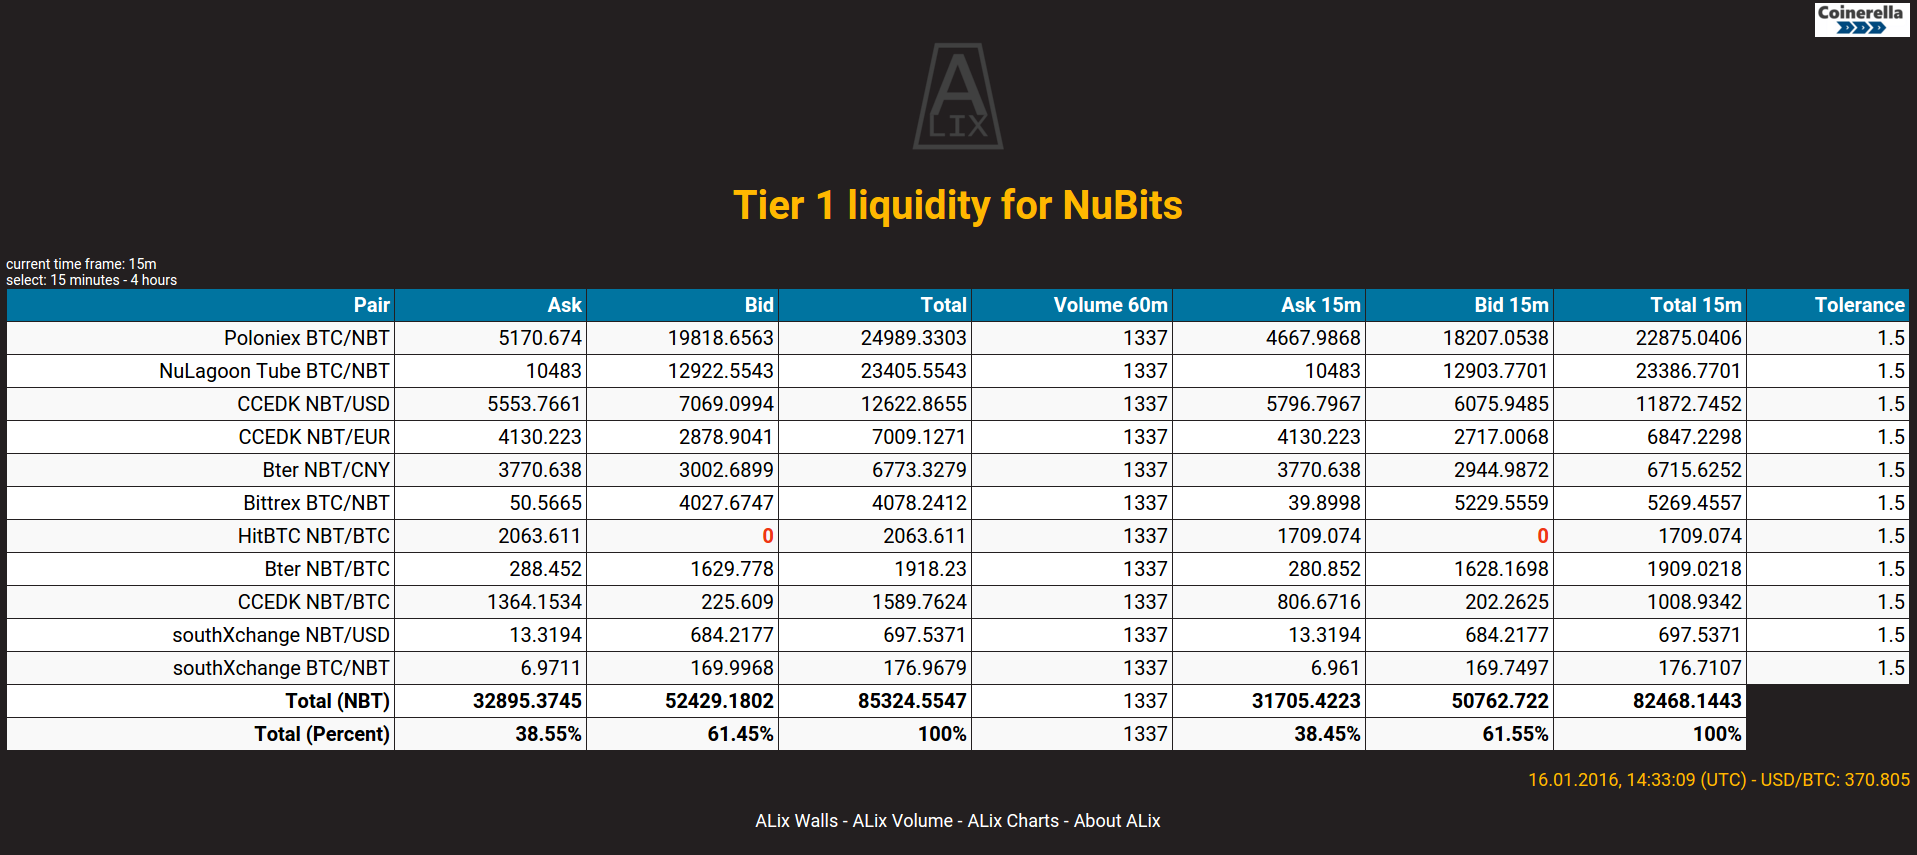
Is it possible to sort the exchanges by trading volume rather than total volume of orders on the book - at least as another option?
It’s hard to track liquidity on the exchanges with lots of volume (which might be more important in terms of peg perception) as soon as sides start to run dry.

Or to say it in a more simple way:
I’d like to have Poloniex on the first row; at least as long as most of thr trading volume is there.

Sure, I guess I could use ALix 1 (yesterdays trading volume) or 3 (3 day MA) for that. Which would you chose?

Last 30-60 minutes trading volume :wink:
Reasoning: the exchange with (recently) the most trading volume is in biggest danger to run dry at one side or another rather sooner than later.
Without trading volume, the walls just remain where they are, unless LPs pull funds.
In fact the total trading volume is less important than the ratio between traded volume and available volume.

Okay. That makes sense.

I’m not gathering that data yet, so it would be a little more work for me (I will have to touch every single exchange wrapper and add the trade history), but I think it will be worth it.

As for the UI, I think I’ll put it right between the current ALix Walls and the MA data.
Like this:

I hope it makes sense.
Before you spend a lot of efforts on it, I’d like to know what others think.
Would that improve the quality of information and provide us with useful data to make better predictions about the need for interventions?

Hey others, what do you think :hatched_chick:?

(bump)

#bump

In other news:
I followed @masterOfDisaster’s request and added the Poloniex side of NuPool to ALix Charts.

https://alix.coinerella.com/charts/?select=48_hours_nupool_poloniex

Enjoy.

2 Likes

In other news:

https://alix.coinerella.com/charts/?select=360d_volume

will fill itself with many beautiful data points over the next 11 months.

I personally like the 90 and 7 day ALix (MA) the most.

NuLagoonTube gets counted twice on ALIX volume because of rebalances (which are economic certainties in the Nu world). [In my opinion this is because NuLagoonTube is T3 and not comparable to other T1 volumes]

Mh. What conclusion do you draw from that?