I’m not a designer so I’m interested in feedback on this infographic. If the general response is positive I’ll consider making more of these.
5 Likes
Where would these be posted at?
Looking forward to retweeting this!


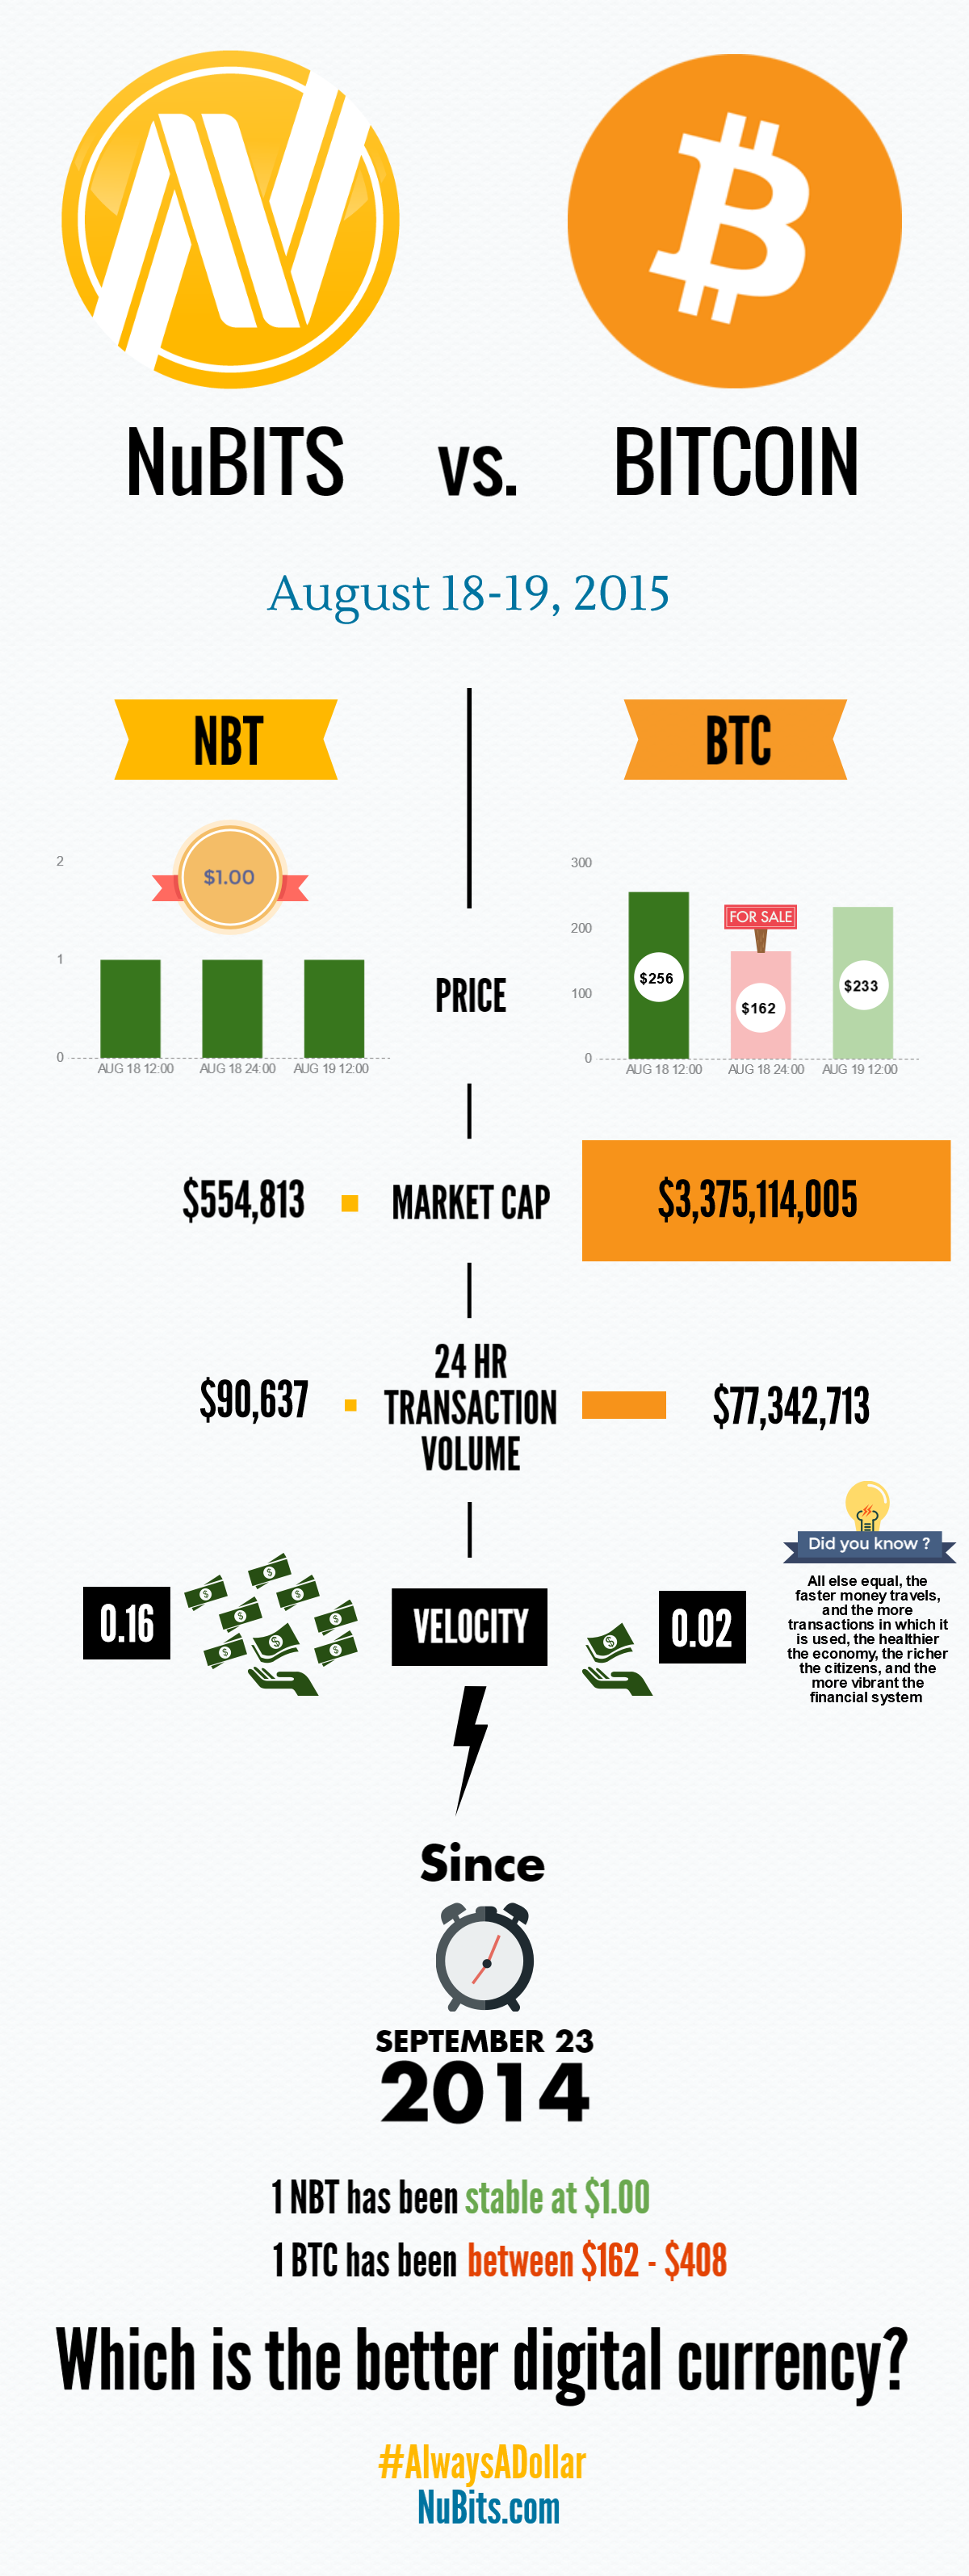
Not sure why you are trying to illustrate the wide disparity in market cap and transaction volume, both of which show Bitcoin as the big winner. The graphics here are horizontal and inconsistent with the vertical bar graphs depicting price immediately above.
While having a crypto-coin pegged to the USD is clearly valuable, I’d be more concerned about the competition for that market. As I type this, Tether has about 2x the 24 hour trading volume of NuBits. Tether users should be warned/reminded about the inherent risks of a centralized system.
2 Likes
Do you think it would look better if the middle Bitcoin bar was a regular shade of red? I think the price crash might stand out more if it was.
This is just a working draft, so I’m sure there’s lots of improvements to be made. Market cap and transaction volume are both components of the third piece, velocity, where NuBits really shines. Velocity on its own without the input data wouldn’t mean much. Do you have any other ideas on how to represent it?
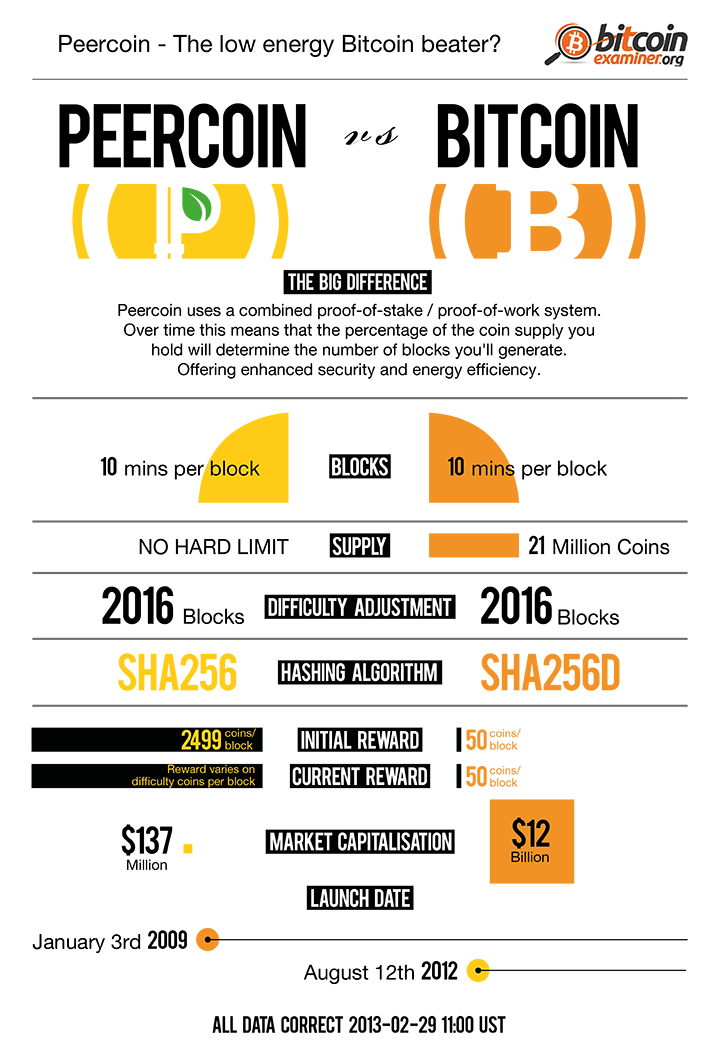
Infographics normally don’t use the same chart type in every instance in order to prevent reader fatigue. Prices are usually displayed on a X and Y axis, while I took the market cap inspiration from a popular Peercoin vs. Bitcoin infographic from a year ago. If you can think of better ways to display the data however I’m willing to make new drafts.
I agree. A “Nu vs. BitUSD vs. Tether” infographic would be interesting. So would a standalone “Nu Network” one.
1 Like
Speaking of, those crypo.fund guys literally just tweeted one out a few minutes ago.
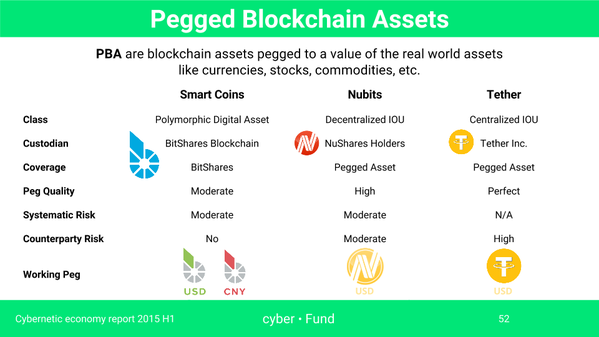
2 Likes
I tweeted them back pointing out that the Nu design isn’t an IOU, and we don’t have counterparty risk anymore now that custodians hold zero shareholder funds. @creator
Continuing the discussion from Infographic: NuBits vs. Bitcoin (August 18-19, 2015):
I understand that one needs two parameters to calculate velocity, but I also think velocity can stand on its own. The graphic explains the concept reasonably well. The stuff above seems to obfuscate the point you are trying to make, especially since Bitcoin is so much bigger. There’s nothing inherently wrong with a big market cap and a large transaction volume.
Paraphrasing approach 1: We concede that the Bitcoin market is orders of magnitude bigger than Nubits, but what’s really important is the velocity of money. Lets use these numbers to calculate and compare the velocity of money and you’ll see the NuBits is better.
Paraphrasing approach 2: Money velocity is what matters and NuBits is significantly higher than Bitcoin.
I prefer approach 2 because it’s an infographic, not a poster for a technical conference.
I don’t know if Tether, being a centralized e-currency, is very relevant here. There are many centralized e-currencies pegged to $1. For example btc-e’s USD circulates outside btc-e and is used to pay goods and services. The btce-USD’s daily trading volume on btc-e is $4 million, 8 times of Tether’s total volume. If Tether is considered, why don’t we compare btc-e USD? Actually why not PerfectMoney USD, OkPay USD … which have way greater volume ?
Tether just gets the worst of both worlds – complexity of a blockchain and risk of a centralized system.
1 Like