I’ve made a preliminary spreadsheet with a rolling daily NAV calculation for assets on exchange at Cryptopia.
The spreadsheet is on Google Docs here: https://docs.google.com/spreadsheets/d/12-WtyJAPM_x3AQuqXh5LBMvQq0ReFyhz3-hiPyQVaMw/edit?usp=sharing
The first sheet is the raw data that I’ve used. I’ve pulled deposits, withdrawals and trades from the Cryptopia API and collected historical Bitcoin prices from the Coindesk HIstrical BPI API detailed here http://www.coindesk.com/api/.
The second sheet is the NAV calculation which I have kept a running total of each asset, adding and subtracting appropriately as deposits, withdrawals and trades take place. Then for each days total, I calculate the dollar value of the Bitcoin on account and add it to the NBT on account (I assume that NBT is $1). The code for this calculation looks like this:
    # transactions
    if activity['activity_type'] == 'transaction':
        if activity['Type'] == 'Deposit':

            if activity['Currency'] == 'BTC':
                btc_total += Decimal(activity['Amount'])

            if activity['Currency'] == 'USNBT':
                nbt_total += Decimal(activity['Amount'])

        if activity['Type'] == 'Withdraw':

            if activity['Currency'] == 'BTC':
                btc_total -= Decimal(activity['Amount'])

            if activity['Currency'] == 'USNBT':
                nbt_total -= Decimal(activity['Amount'])

    # trades
    if activity['activity_type'] == 'trade':

        if activity['Type'] == 'Sell':
            nbt_total -= Decimal(activity['Amount'])
            btc_total += Decimal(activity['Total'])

        if activity['Type'] == 'Buy':
            nbt_total += Decimal(activity['Amount'])
            btc_total -= Decimal(activity['Total'])
The third sheet is a chart showing the NAV per day. It’s the same chart as below:
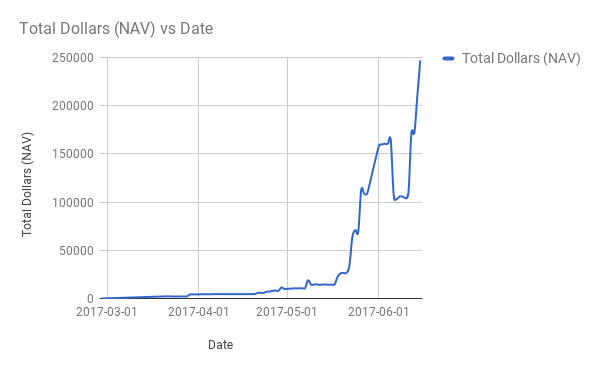
While I am confident that the maths is good and the data complete, I would appreciate any feedback on the calculation and my method along with any improvements anyone would like to see. As mentioned elsewhere, the next step will be to do similar with assets at Bittrex or held elsewhere, then to automate the update of the data and populate a dynamic chart somewhere where it’s immediately obvious to all.
2 Likes
I’m no accountant & don’t have time to analyse this right now, but opening up as close to real-time data on the health of the system is a very important step to building understanding, credibility, and show where things need to improve.
Great work @woolly_sammoth. I look forward to this progressing!
4 Likes
I completely agree. There are many more ideas for charts to show the network health so more will follow.
I know that the NAV was heavily requested though which is why I chose to concentrate on it.
Similarly, I am not an accountant so would really value it if someone who knows this stuff can provide some constructive criticism.
3 Likes
Can we see it with just the trades? This chart mostly just plots the deposits.
Sure, here’s the chart without deposits and withdrawals.
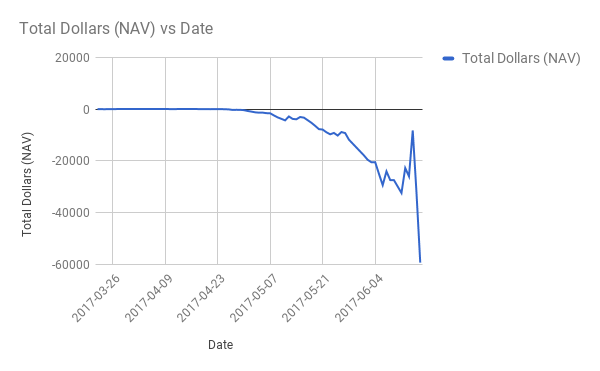
I’d be cautious about reading too much into the sharp drop at the end of the graph. I will re-compile it at the end of the day and would fully expect it to become shallower as trades today are carried out.
One question. Once the values from Bittrex and other fund locations are added in, should the deposits and withdrawals be added back in? It feels like that’s a fuller data set, although a deposit on Cryptopia would be cancelled out by a Withdrawal somewhere else so perhaps it’s not important until there’s a source of income to the fund pool.
1 Like
One simple mechanism, that avoids using the full trade history, is to take the current 24 hr MA of the btc price, and do:
[Current (NBT+priceBTC) on exchange] - [Total (NBT+priceBTC) deposited-withdrawn]
I think you could graph this by day, as well. A deposit (or withdrawal) would not be visible on such a graph, as it would appear in both terms.
If you dont have e.g. “current nbt on exchange” for a particular day, you can calculate it from the full trade history. This method is far more complicated, however. Ultimately, you do need a daily record of the 24-hour MA, but you can probably pull that from coinmarketcap API.
Thanks for the suggestion. Ultimately, I’m not worried about displaying the full trade history as that is the sort of thing that should be publicly available. I think the ultimate aim will be to calculate the NAV on a trade by trade basis as them it can be accurate for the Bitcoin price at that moment which would also help to highlight any points at which NuBot has the orders placed at the wrong price.
Here’s the results of my method for the first few hundred trades. As you can see, it gives a pretty managable number corresponding to the actual $$ earned by trading. I had trouble parsing dates and deposits, so I didn’t go too far, but this represents about the first month of trades. As you can see, not a whole lot of profit was made or lost on the venture, about $20 over the course of a month. This is a good result, and very practical. I’d really love to see it for the full data set. It can easily be done on a trade by trade basis as you have the btc price recorded already. You can just keep a running nbt and btc total and subtract off the total amount deposited.
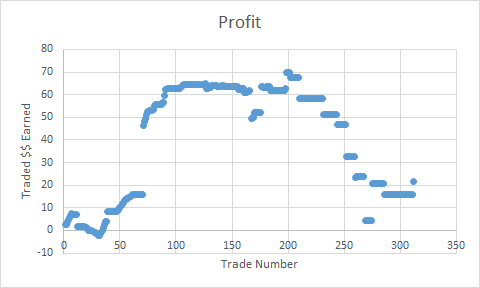
Think of it as NAV on exchange - hypothetical NAV of deposits if they weren’t traded.
5 Likes