The following charts are derived from the data posted in this thread.
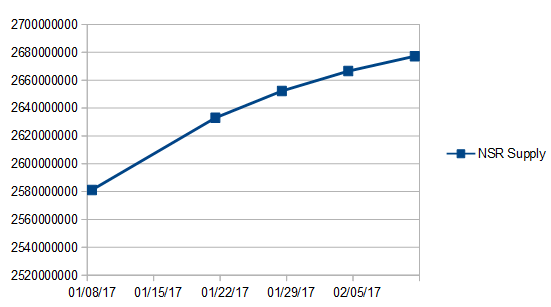
The trend is for NSR supply to increase, but at a rate that decreases consistently. Just after buy backs begin, the NSR supply will begin to decline.

Total currency supply is up 13% from its low on January 14th. Generally, total currency supply and NSR supply will move inversely, but there is a lag in the NSR supply following changes in the currency supply. After an extended period of decline in currency supply, the first increases will reduce the size of NSR sales, but they don’t switch to NSR buybacks until the trend has been sustained long enough to build reserves and reduce the deviation from reserve equilibrium.

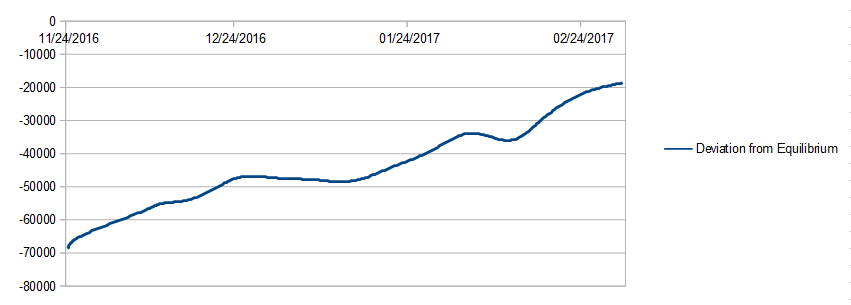
The Variance from Reserve Equilibrium is the most important and meaningful metric showing where Nu is in the cycle of currency supply expansion and contraction, which roughly correlates to NSR sales and NSR buybacks. At zero, or equilibrium, neither NSR sales nor NSR buybacks occur. The farther it moves into negative territory, the greater the quantity of NSR sales will be. As the variance becomes positive, NSR buybacks begin, with the quantity of NSR buybacks moving in lock step with the size of the variance.
In less than three months, the variance from reserve equilibrium has moved most of the distance to zero, from -$69,000 to -$29,000. We have seen a proportionate drop in the USD value of NSR sold each day.